About
About
Applied AI for Enterprise
What this is
A decision tool, not a list
Applied AI for Enterprise is an opinionated, practitioner's view of where enterprise AI is worth the investment, for the people who decide where to spend: CIOs, CDOs, and architects in large organisations.
It does two things. It scores 350+ AI use cases on business value and feasibility, so you can see what is worth building. And it places the categories of the enterprise AI stack into four rings (Adopt, Trial, Assess, Hold), so you can see what is ready. Everything is scored against a consistent, published model. No vendor pays for placement, and nothing is ranked by popularity.
Who's behind it
Built by an enterprise architect

The radar is curated by Christophe Guerdoux, an enterprise architect who works at the seam between AI ambition and delivery.
The point of view is deliberately a practitioner's, grounded in what actually ships inside large organisations, not what demos well. The same scoring model behind the radar is the one used in client work to prioritise real AI backlogs. The methodology below lays it out in full, so you can judge the reasoning, not just the ratings.
Looking for how to prioritize AI use cases, not the formulas? Start with the prioritization framework. This page is the scoring reference behind it.
Methodology
How every score is computed
The rest of this page is the model in full: the data structure, the controlled vocabularies, and the exact formulas behind value, feasibility, maturity, and the recommendation rings.
Data model
The structure behind every use case
Applied AI use cases for enterprises are organized around a central table, structured by value domains and capabilities, industries, patterns, and modalities. Associated risks and controls are assessed, while supporting evidence and market signals are detected. KPI scores are then computed based on multiple criteria, as detailed below.
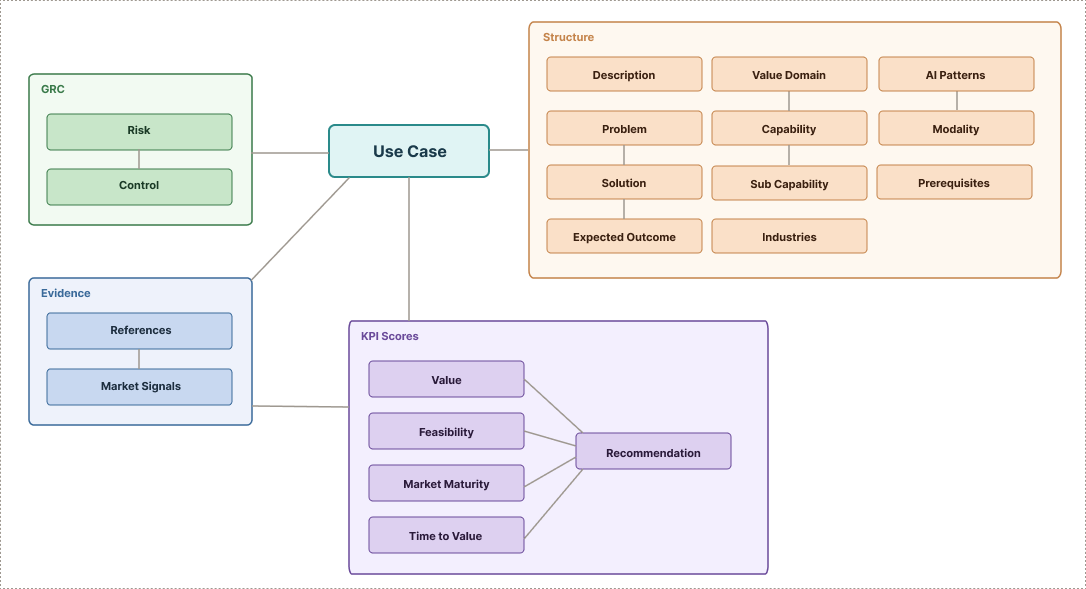
Taxonomy
Controlled vocabularies
Every record is tagged against a set of controlled vocabularies, the firewall that keeps the data comparable across all use cases.
Value Domains
The 11 high-level business domains that organise the capability tree, derived from the APQC Process Classification Framework. A use case attaches to one primary domain. The same domains anchor the Value axis of the Market Radar.
AI Patterns
The 12 things AI can do to a business object to produce value, a function, not a technology. Each use case carries one mandatory primary pattern.
Structure the input
Estimate & decide
Work with content & knowledge
Market Maturity
How proven a use case archetype is, not how mature your specific implementation is. Derived from weighted evidence across case studies, analyst reports, and peer-reviewed work.
≥ 6 weighted evidence points and ≥ 3 named production deployments.
Weighted evidence ≥ 2, active commercial deployments, limited case studies.
Below Scaling threshold, research-stage or unverified market presence.
Recommendation Rings
The four-quadrant decision signal for enterprise leaders. Computed from Value and Feasibility scores, capped by Maturity and Risk.
High value, high feasibility, proven or scaling maturity. Strong candidate for investment.
Strong signal on value or feasibility. Worth a controlled experiment with clear success criteria.
Worth monitoring. Not ready to commit resources, governance or evidence gaps remain.
Low value or feasibility at archetype level. Revisit if the market signal changes.
Scoring
How we score the KPI's?
Scores are generic and archetype-level, they estimate how a use case behaves in a typical enterprise before company-specific calibration. They are not a vendor rating, not a popularity signal, and not a business case.
Value
Measures the generic business case strength of the use case, how painful the current process is, how often it occurs, the economic leverage, and whether it matters across industries. A high Value score means the use case solves a widely-felt, high-stakes problem.
Show formula
Value = (pain_intensity / 5) × 0.25
      + (frequency_volume / 5) × 0.20
      + (economic_leverage / 5) × 0.15
      + (cross_industry / 5) × 0.15
      + (decision_quality / 5) × 0.15
+ (strategic_relevance / 5) × 0.10| Dimension | Weight |
|---|---|
| Pain Intensity | 25% |
| Frequency / Volume | 20% |
| Economic Leverage | 15% |
| Cross-Industry Applicability | 15% |
| Decision / Quality Impact | 15% |
| Strategic Relevance | 10% |
Feasibility
Measures how ready a typical enterprise is to implement this use case, data availability, integration complexity, process standardisation, and regulatory exposure. Value and Feasibility are always kept independent: a high-value, low-feasibility use case is a strategic bet, not a quick win.
Show formula
Feasibility = (data_availability / 5) × 0.20
            + (data_standardization / 5) × 0.20
            + (integration_simplicity / 5) × 0.20
            + (ai_maturity_technique / 5) × 0.15
            + (process_standardization / 5) × 0.15
            + (risk_compliance_simplicity / 5) × 0.10

ai_maturity_technique  →  derived from primary AI pattern
                           (extract/classify → 5, generate/optimize → 3)
risk_compliance_simplicity  →  derived from risk profile
(AI Act high-risk → 1, no exposure → 5)| Dimension | Weight |
|---|---|
| Data Availability | 20% |
| Data Standardization | 20% |
| Integration Simplicity | 20% |
| AI Maturity (technique) | 15% |
| Process Standardization | 15% |
| Risk / Compliance Simplicity | 10% |
Maturity
An evidence-derived signal, not a score. It answers: has anyone actually deployed this at scale? Evidence is weighted by source quality and recency, a named production case study counts more than a vendor blog post, and a 2025 deployment counts more than a 2022 one.
Show formula
weighted_evidence = Σ (source_weight × recency_weight) over verified references

Source weights:
  production case study  1.0   analyst / peer-reviewed  0.8
  reputable news         0.5   vendor blog              0.3   other  0.1

Recency weights:
  ≤ 12 months  1.0   12–24 months  0.6   24–36 months  0.3   > 36 months  0.1

Proven   →  weighted_evidence ≥ 6  AND  ≥ 3 named production refs
Scaling  →  weighted_evidence ≥ 2
Emerging →  below Scaling threshold
Recommendation
A pure projection of Value and Feasibility through a 3×3 grid, then lowered by Maturity and Risk ceilings. It is never hand-set, only overridden via an audited override layer when the generic estimate diverges significantly from observed reality.
Show formula
Band Value and Feasibility: High ≥ 70 · Med 40–69 · Low < 40

Base grid:
              F-High    F-Med    F-Low
  V-High      Adopt     Trial    Assess
  V-Med       Trial     Trial    Assess
  V-Low       Hold      Hold     Hold

Ceilings (can only lower, never raise):
  Maturity = Emerging          →  max Trial
  AI Act High Risk / critical  →  max Assess
Time to Value
An estimate of how quickly a typical enterprise could realise value from implementation, combining how feasible the use case is (ecosystem readiness) with how mature the archetype is (proven deployment paths shorten delivery).
Show formula
tti = (Feasibility / 100) × 0.60 + maturity_norm × 0.40

maturity_norm:  Proven 1.0 · Scaling 0.6 · Emerging 0.3

Buckets:
  ≥ 0.75  →  0–3 months
  ≥ 0.55  →  3–6 months
  ≥ 0.35  →  6–12 months
  < 0.35  →  12+ months
Market Radar
How we score the Market Radar
The Market Radar uses a different model from the use-case scoring above, on purpose. Use-case scoring is an implementation view (is this opportunity worth building in a typical enterprise?). The radar is a market-readiness view (how mature is this category of the enterprise AI stack right now?). The categories across the 5 axes are each scored on the same five criteria, blended into a composite that sets the ring.
The five criteria
Each criterion is scored 0 to 100 on an absolute, enterprise-calibrated scale, then blended into the composite by the weights below.
| Dimension | Weight |
|---|---|
| Market Maturity | 25% |
| Adoption Momentum | 25% |
| Technology Readiness | 20% |
| Strategic Relevance | 20% |
| Governance & Risks | 10% |
Governance & Risks measures governance readiness: a higher score means controls are mature and residual risk is low, not that the category is risky. So Access Control and PII Protection score high, while Agent Platforms and AI Security score low (risk is still hard to manage today).
From composite to ring
The ring is derived from the composite, never hand-set, so a category's position and its bars always agree.
Composite 80 to 100. Commoditized and proven, safe to standardise on now.
Composite 60 to 79. Real production use with known caveats, worth a controlled rollout.
Composite 40 to 59. Strategically important but immature, watch and pilot narrowly.
Composite 0 to 39. Not ready for enterprise investment yet.
Composite and ring
v1 is a deliberate, deep-researched baseline: each category's five scores and a one-line rationale come from a structured research pass, frozen for the edition rather than wired to live evidence. As evidence accumulates, the scores can move to an evidence-driven basis without changing the display. One bridge between the two models: a Value Domain dot's size reflects the average implementation score of that domain's use cases.
Show formula
composite = market_maturity      x 0.25
          + adoption_momentum    x 0.25
          + technology_readiness x 0.20
          + strategic_relevance  x 0.20
          + governance_readiness x 0.10

Ring (derived from the composite, never hand-set):
  Adopt    80 to 100
  Trial    60 to 79
  Assess   40 to 59
  Hold      0 to 39
Want to apply this model
to your portfolio?
We help enterprise teams run the scoring against their own use case backlog, calibrated to their industry and strategic priorities.
Let's talk